
Introduction
An organizational chart is like a map for companies. It shows at a glance who is responsible for what, helps new employees find their bearings, and ensures transparency about the team structure. But traditional models like the SAP organizational chart usually only depict the formal hierarchy — the so-called structural organization.
What often remains invisible are the dynamic aspects of collaboration, such as agile project teams, cross-functional cooperation, or informal networks — in other words, the actual operational organization. Especially in larger organizations, entire teams are needed to maintain such charts manually. This is not only time-consuming and expensive, but also poses a risk. If updates are missed, outdated depictions of the organization arise. And relying on incorrect data can lead to poor strategic decisions — whether in workforce planning, project management, or change processes.
That’s why a comprehensive and agile organizational chart is far more than a nice-to-have. It is a key management tool for anyone aiming to purposefully develop their organization.
In this blog post, you’ll learn how to use a modern, agile organizational chart to make current team structures and true collaboration in your organization visible — including practical examples.
The Weaknesses of Traditional Organizational Charts
We all know the scenario: You need an image of the organization for a management meeting or to prepare for a transformation. Somewhere on the intranet, you find the company’s org chart, either last updated 297 days ago or currently accurate — but not truly reflective of how the organization operates. In times of constant change, agile work environments, and new organizational forms, these traditional charts quickly become outdated. What was meant to provide orientation is often already obsolete by the time someone opens it.
The problem lies not only in the speed of change but also in the process behind it. Organizational charts are often maintained centrally — typically by HR or a staff department that doesn’t have real insight into how teams actually collaborate. Especially in agile work environments, these charts at best represent the formal structure (the structural organization) — who works on what topics and how teams actually interact (the operational organization) remains invisible. This creates a distorted image of the organization, which can be problematic for both HR and department leaders.
A practical example: Before an employee survey can be launched, Excel lists first have to be painstakingly created, sent to department heads, and reviewed in order to capture the current team structures. These often differ significantly from the official SAP organizational chart, since agile teams work across departments and new constellations are constantly forming.
The result: High manual effort, error-prone data, and a rigid view of an organization that has long since evolved to operate more flexibly. What’s needed is a modern organizational chart that not only maps structures but also makes the dynamics and reality of collaboration visible.
A Dynamic Organizational Chart: The Modern Solution
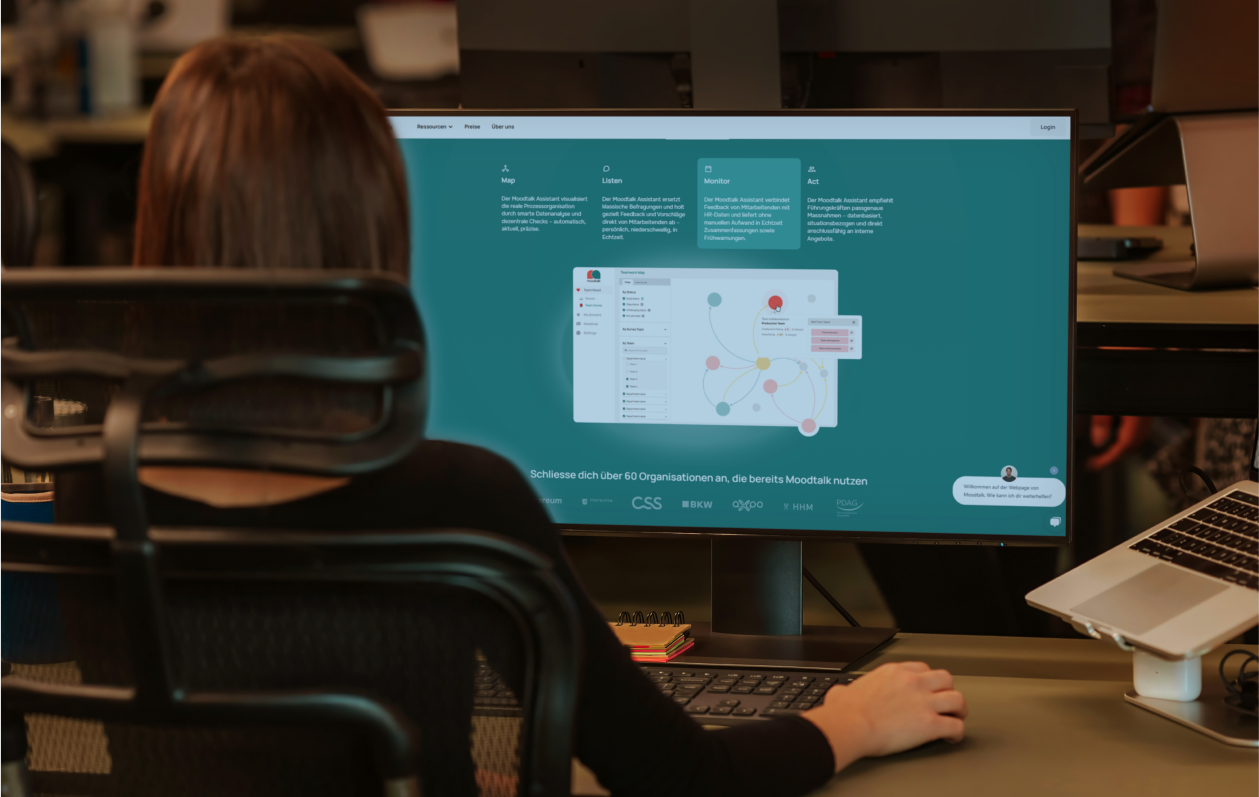
An agile organizational chart does more than just provide transparency — it reflects the reality of collaboration as it is truly practiced: across team boundaries, flexible, and always up to date. This is exactly where the Moodtalk Assistant comes in. It helps make these complex structures visible and keeps them continuously updated. This happens automatically, in a decentralized way, and seamlessly integrated into everyday work.
How Does a Dynamic Organizational Chart Work and What Should It Be Able to Do?
- Automatic Updates: Changes (e.g. new team members, restructurings) are automatically incorporated. In case of uncertainties, the Moodtalk Assistant, for example, contacts the person who most likely knows how the change should be represented. The agile organizational chart is always up to date, with minimal manual maintenance and a low risk of errors.
- Decentralized Maintenance: Changes in a modern organizational chart can be made directly by department heads, team leads, project managers, or even employees themselves. With Moodtalk as well, updates can be entered directly by those who have the best overview. This relieves pressure on central departments like HR and ensures that the true nature of collaboration is accurately reflected.
- Representation of Agile Team Structures: Not just departments, but also project teams, task forces, or scrum groups should be visible — including multiple team memberships. Moodtalk allows employees to be assigned to several teams simultaneously. This makes agile methods and flexible role distributions visible, as they have long been part of everyday life in modern organizations.
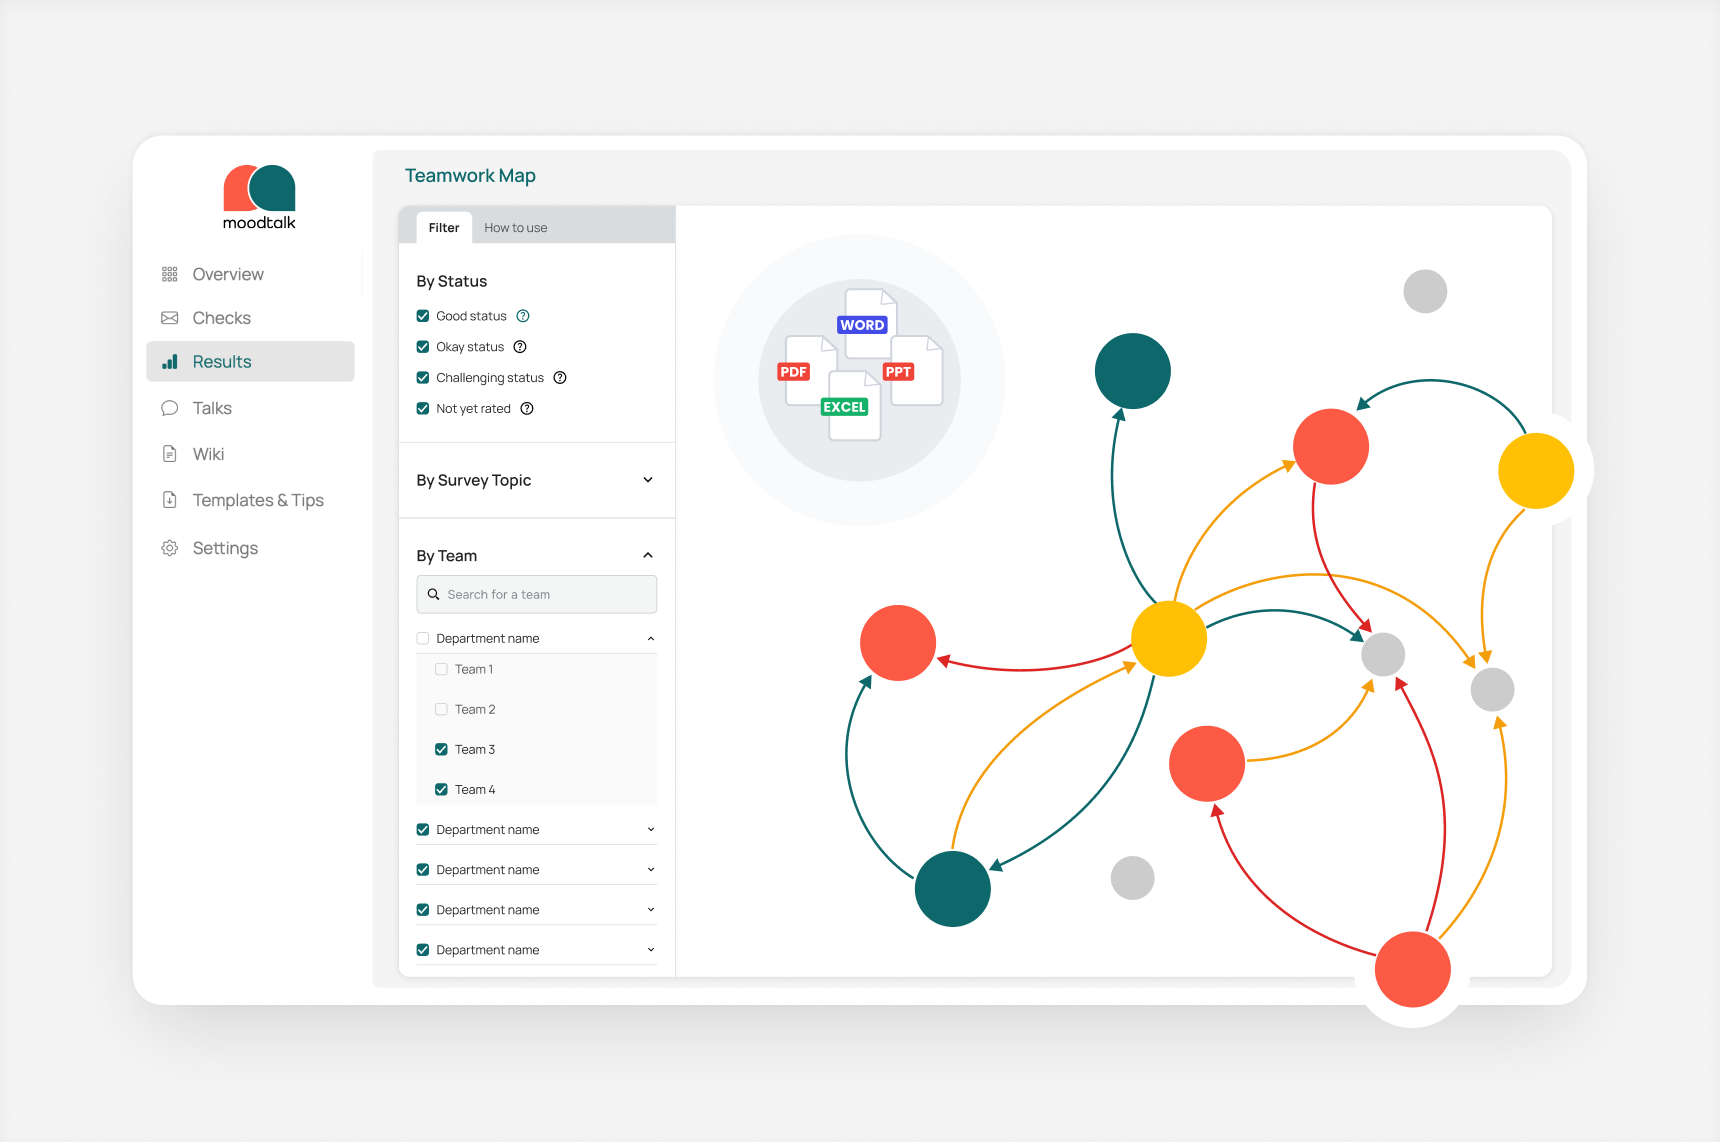
- Interactive Interface: Information must be quickly discoverable and intuitively accessible. Through a user-friendly interface with search and filter functions, users in Moodtalk can easily find people, responsibilities, or lines of collaboration. This simplifies cross-departmental coordination and prevents duplicated work.
- Transparency and Access Rights: Openness is important, but not everyone should see everything. Moodtalk enables differentiated permission settings. This ensures transparency, which strengthens collaboration, while also maintaining data privacy and protecting sensitive information.
In short: A dynamic organizational chart like the one from Moodtalk digitally maps the living structure of your company and provides a true representation of the organization with minimal effort.
The Dynamic Organizational Chart as a Foundation for Strategic Decisions
In an increasingly dynamic business world, it is becoming more important than ever for executive leadership to quickly access reliable and up-to-date information. Many organizations use software to create a modern organizational chart. This not only displays the traditional structural organization but also allows for easy updates by managers and HR.
However, a modern organizational chart alone is no longer sufficient to keep up with today’s complexity and pace. Companies need a dynamic organizational chart that can flexibly adapt to new requirements and structures, update itself automatically, and contact the right people when changes are needed. This is where Moodtalk comes in. The dynamic, automatically synchronized organizational chart simplifies strategic decision-making by providing greater transparency and a reliable data foundation. Thanks to automatic updates, all organizational chart data is always up to date. Planning errors caused by outdated structures are a thing of the past.
The dynamic organizational chart becomes a living representation of actual collaboration within the company. Executive leadership and organizational development teams can immediately see where interfaces, bottlenecks, or isolated team structures exist — and take targeted action. The agile organizational chart supports systematic organizational development by making ongoing improvements visible and enabling well-informed decisions based on current data.
A concrete example: If an organization is planning a restructuring to increase efficiency and productivity, the dynamic organizational chart instantly displays the current state of collaboration. Bottlenecks become visible without the need to create a costly and time-consuming snapshot. The organization can also integrate HR analytics data into the dynamic chart — allowing not only insight into how teams are working together but also how well that collaboration is functioning. On this basis, the right decisions for the organization’s further development can be made within a very short time.
When planning new strategic initiatives or restructurings, different scenarios can be simulated. Their impact on the organization becomes immediately visible. Especially in systematic organizational development, a modern, smart organizational chart proves to be an essential tool.
Through the intelligent linking of the organizational chart and real-time collaboration, a central information platform is created that brings together all relevant data on employees, teams, and projects. This breaks down data silos, promotes cross-departmental transparency, and provides lasting support for organizational development. The result: fact-based decisions, greater agility, and an organization that is optimally prepared for the challenges of the future.
Practical Use Cases
Understanding and Managing Organizational Dynamics:
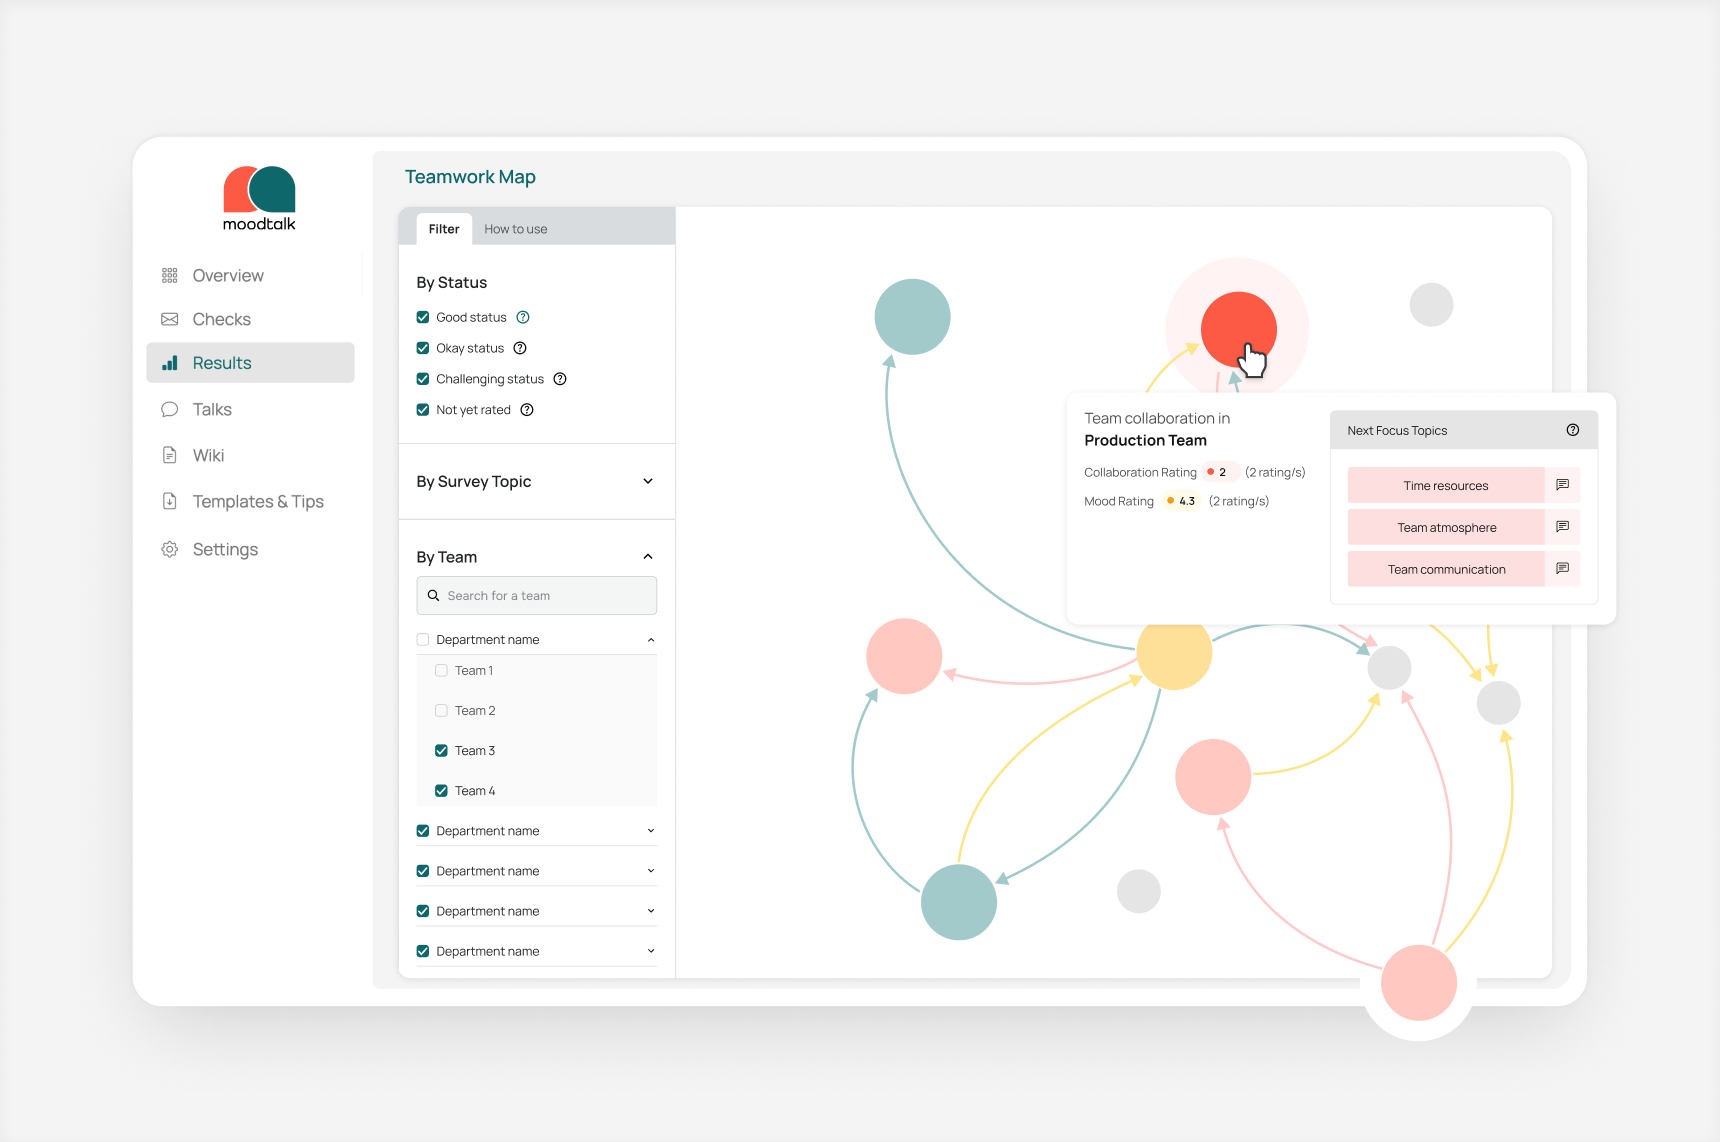
A smart organizational chart not only displays the current structure of a company but also provides important additional insights: How many people are working in a team? What topics are currently engaging the teams? How is the team’s mood developing compared to turnover or absence rates? Leaders can detect critical developments early on and understand the connections between team sentiment, workload, and personnel changes. This creates a solid foundation for targeted improvement measures.
Example: In an IT department, the modern organizational chart shows that team morale has been declining for three months while the sickness rate is rising. A targeted relief measure — by redistributing project responsibilities — quickly leads to improvement.
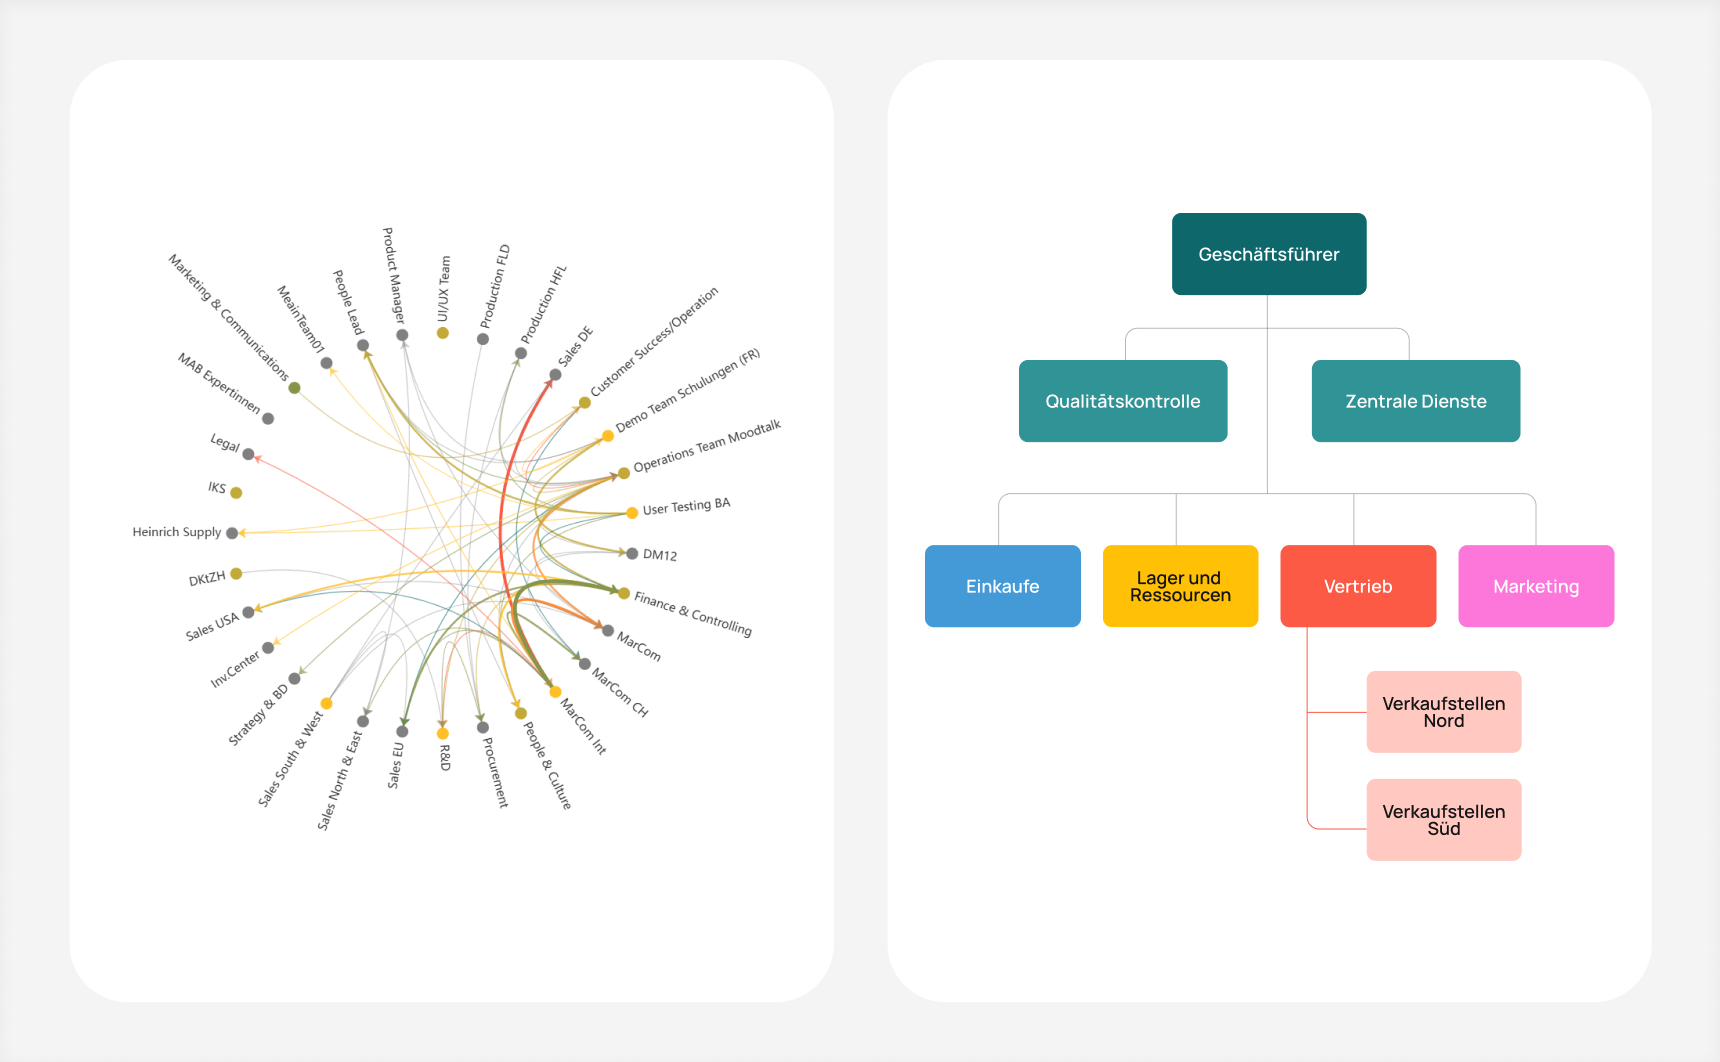
Making Collaboration Between Teams Visible:
The agile organizational chart illustrates which teams work closely together and where there are organization-wide bottlenecks or interface issues. This often differs significantly from the hierarchical org chart. By analyzing the connections and interactions, weak points or particularly successful collaborations can be identified. Teams can then be specifically supported to improve cross-departmental collaboration and break down silos.
Example: The marketing and sales teams work closely together, but there are hardly any connections to product development. A joint monthly meeting is introduced to systematically share feedback and strengthen collaboration.
Optimizing Team Development and Reorganization:
By analyzing the dynamic organizational chart, it becomes clear which individuals and teams collaborate particularly well. This enables early identification of problem areas and allows teams to be restructured proactively. Rather than relying on chance or waiting for issues to arise, organizations can be designed to function effectively from the start.
Example: In a construction project, it becomes apparent that one project manager frequently acts as a key interface between teams. He is intentionally assigned to moderate kick-off meetings to promote knowledge transfer.
Conclusion: How Companies Become Future-Ready with Dynamic Organizational Charts
The organizational chart of the future is dynamic, up to date, and interconnected. With minimal effort and high automation, it maps agile team and project structures as well as the true operational organization, promotes transparency, and strengthens cross-functional collaboration. At the same time, it provides a solid foundation for decision-making at all levels. Moodtalk offers a modern and integrative solution for organizational development through its dynamic organizational chart.
A modern organizational chart evolves into a living information hub, forming the foundation for sustainable success in both day-to-day operations and long-term strategy. Through smart automation, AI, and the use of decentralized knowledge, the dynamic organizational chart is continuously updated with minimal effort and provides the basis for HR analytics, surveys, and organizational development.
Want to learn more practical insights about how a dynamic organizational chart can be created and used? Then book a session with the expert team at Moodtalk.
FAQ: Frequently Asked Questions
- What is a dynamic organizational chart? A dynamic organizational chart is an automatically updated representation of a company’s structure, including agile teams and network relationships.
- How can I create a dynamic organizational chart? The best approach is to use software like Moodtalk, which integrates data in real time and maps flexible team structures.
- Why is an SAP organizational chart often not sufficient? An SAP organizational chart primarily shows the official hierarchy within a company — that is, who reports to whom. However, it does not represent agile project teams or informal networks, which are especially important in modern organizations. As a result, more than 40% of actual collaboration is often missing from traditional org charts.
- What does systemic organizational development mean? Systemic organizational development views organizations as dynamic networks rather than rigid hierarchies and promotes flexible thinking and action.
- How do HR, organizational development, and executive leadership benefit from a smart organizational chart? It provides better decision-making foundations, greater transparency, and faster responsiveness to change.
Sources


.jpg)
.png)


